As investment stewards, we at Manchester Capital seek to preserve, protect, and grow client assets given the prevailing market, economic, and political climates. We do not take political positions, believing that doing so could unduly influence our financial decision making. Instead, we focus solely on our mission of helping clients achieve their financial objectives.
It is through this lens that we review the market’s response to the first 100 days of the second Trump Administration—beginning January 17th, the final market close before inauguration, and ending 100 days later with the market’s close April 30th. While the first 100 days is an arbitrary metric, it is instructive in understanding the market’s attitude toward the administration’s actions.
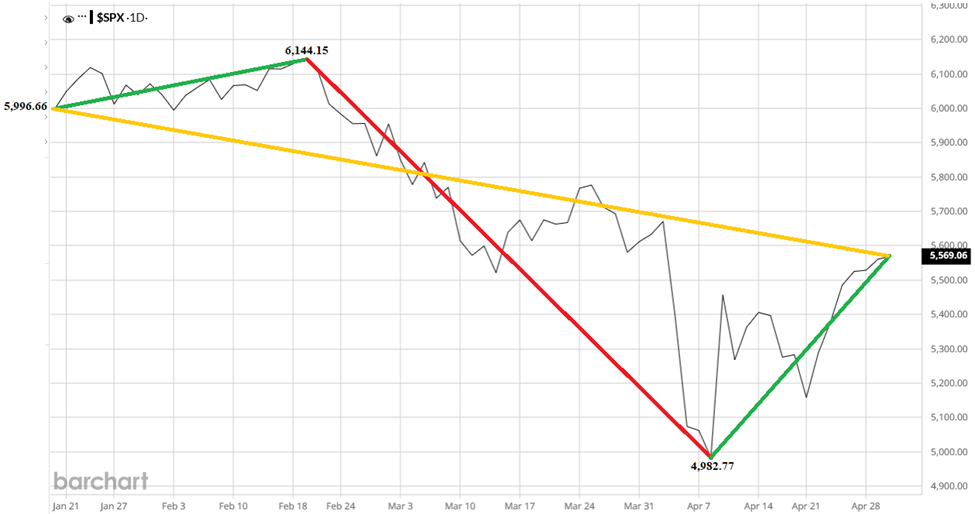
During this 100 day period, there have been 78 trading days for the market. Using the S&P 500 as a market proxy, the market closed January 17th at 5,996.66, peaked February 19th at 6,144.15, bottomed on April 8th at a low of 4,982.77, and closed April 30th at 5,569.06. Those fluctuations represent a rise of 2.5%, a decline of 18.9%, and a recovery of 11.8%, respectively. In total, from day 1 to day 100, we have seen a 7.1% decline (excluding dividends). Year-to-date through the close May 13th, including dividends, the market is down 0.18%.
To say the market has been volatile would be an understatement. Over the last 90+ years, each day the market has moved 1% higher or lower an average of 25% of the time.1 Over the 78 trading days in question, 40% (28 days) saw the market close more than 1% from where it started. Also notable has been the magnitude of the intraday point swings. Of the 20 largest intraday point swings since 1967, six occurred during this 100 day period with five occurring in the consecutive trading days of April 4th through April 10th—the days following the administration’s announcement of its “reciprocal” tariff policy. Additionally, the 8th largest percentage change gain since 1923 occurred on March 9th when the market closed 9.5% higher than the previous day.2
No. According to JP Morgan, over the last 45 years, the market’s intra-year drop (from the high to the low) has averaged 14.1%. As noted above, the 2025 intra-year drop so far is 18.9%, making it the 12th largest.3 Since 1928 there have been 57 market pullbacks of 10% or more, an average of one every 1.7 years.4 So while the first 100 days of the second Trump Administration has seen its share of large market moves, those changes are not unprecedented. Even the current market volatility, if it continued at the same 40% pace, would make 2025 only the 17th most volatile year since 1930.
Historically, the market performs best during times of divided government—periods characterized by little or no change and where any legislation must be achieved through compromise. In its first 100 days, the Trump Administration issued 142 executive orders, a record number. This pace of change, combined with the haphazard imposition and implementation of Trump’s tariff strategy, contributes directly to the market’s volatility—businesses cannot plan when the rules change daily. If businesses cannot plan, and in some cases do not even know what their input costs will be day-to-day, analysts cannot forecast earnings.
Despite the volatility, the market continues to trade at a high multiple of forward earnings estimates. According to JP Morgan, the average forward price-to-earnings (P/E) multiple over the last 30 years has been 16.9x. The current forward P/E is 21.6x5 on 7.7% projected earnings growth. This high ratio suggests there are policy elements about which investors are optimistic. We believe the current above-average P/E multiple reflects some combination of investors’ beliefs: a) that spending cuts will slow the pace of growth of the national debt; b) that trade agreements will expand the market for U.S. goods and services or reduce the tariffs on U.S. products overseas; c) that the promises of artificial intelligence, which drove tech stocks in recent years, will materialize in applications that increase productivity; and d) that individual or corporate tax rates will be lowered to offset the impact of tariffs.
Investors tend to pay up when they believe the future will be brighter than today. Just as the Federal Reserve sits on the sideline awaiting more data, unsure if we will see heightened inflation as a result of tariffs (requiring higher interest rates) or increased unemployment caused by a slowdown in economic activity (requiring a stimulative reduction in rates), we believe a clearer picture will emerge over the next several months as trade deals are announced and Congress passes a budget and tax plan. As we wait, strap in—it’s going to be a bumpy ride.
If you have questions about how your portfolio is weathering the market’s volatility, please reach out to your wealth manager
Disclosures
This material is solely for informational purposes and shall not constitute a recommendation or offer to sell or a solicitation to buy securities. The opinions expressed herein represent the current, good faith views of the author at the time of publication and are provided for limited purposes, are not definitive investment advice, and should not be relied on as such. The information presented herein has been developed internally and/or obtained from sources believed to be reliable; however, neither the author nor Manchester Capital Management guarantee the accuracy, adequacy or completeness of such information. Predictions, opinions, and other information contained in this article are subject to change continually and without notice of any kind and may no longer be true after any date indicated. Any forward-looking predictions or statements speak only as of the date they are made, and the author and Manchester Capital assume no duty to and do not undertake to update forward-looking predictions or statements. Forward-looking predictions or statements are subject to numerous assumptions, risks and uncertainties, which change over time. Actual results could differ materially from those anticipated in forward-looking predictions or statements. As with any investment, there is the risk of loss.

It is once again that most joyous time of year where we step back to take time with our families, reflect on the accomplishments of the year that has...

For ultra high-net-worth (“UHNW”) families, integrating health into wealth planning isn’t optional — it’s essential for legacy,...

Can you invest in a way which is environmentally and socially conscientious while still producing solid returns? ESG—shorthand for Environmental,...